
Voir aussi


 16.09.2026 04:48 AM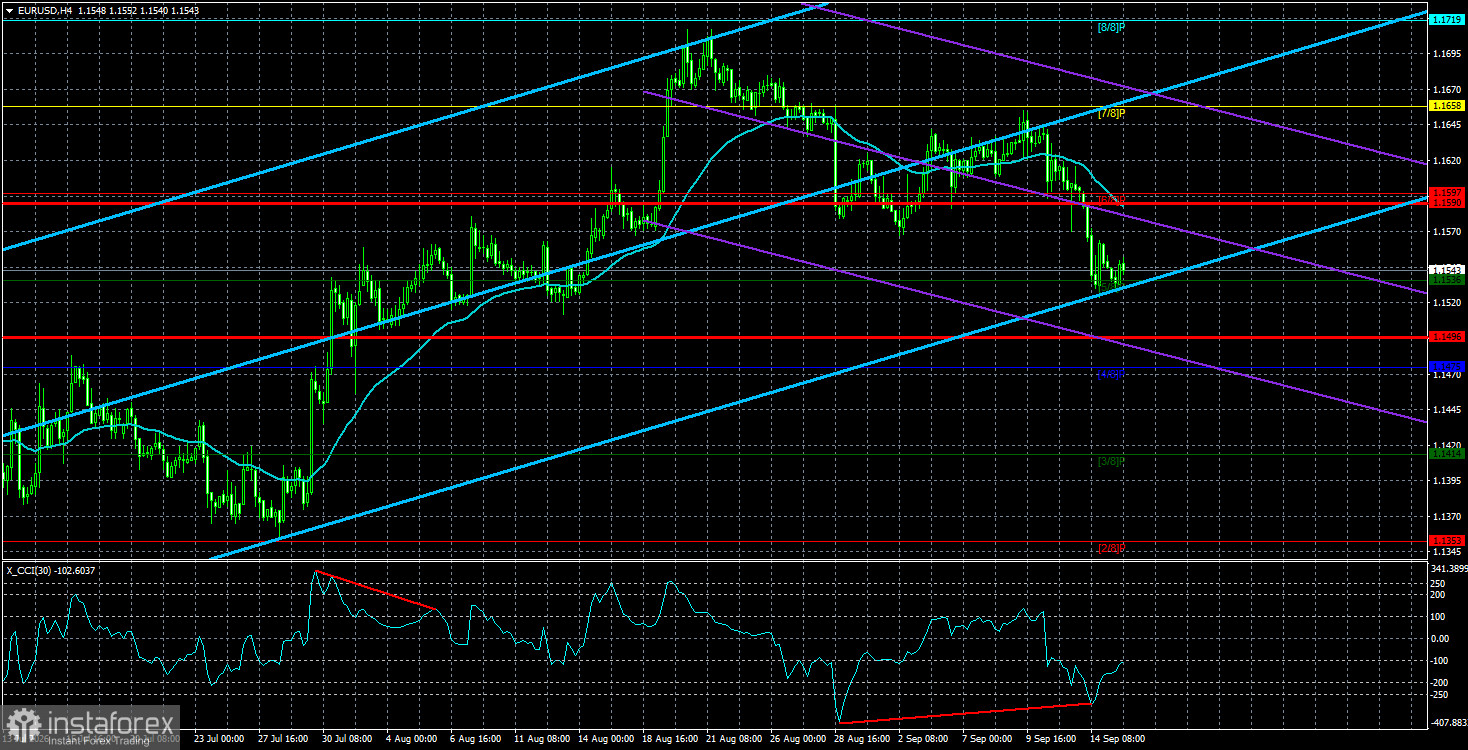
The EUR/USD currency pair unexpectedly plunged about 60 pips on Monday before the start of the U.S. session, but by Tuesday, market movements had calmed, and the U.S. dollar had effectively completed its three-day rally. Recall that last week there were no solid reasons for the dollar's rise. The European Central Bank meeting was fully "hawkish," as expected, and should have prompted euro strength. If the market priced in the rate hikes in the euro area (even though the euro did not particularly rally before the meeting), we should see a similar reaction to the Federal Reserve meeting this week. Right now, no one doubts the Fed will raise the policy rate, and the dollar has risen three days in a row without any clear local reasons. Note also the U.S. inflation report, which the market awaited like Nonfarm Payrolls but which showed neither acceleration nor a notable deviation from forecasts. Thus Friday's dollar rally also raises some questions. In summary: from Thursday through Monday, the market actively priced in future Fed tightening. The only remaining question is what to expect after the Fed meeting, which takes place this evening.
Logically, the dollar should fall in practically any scenario. If the market already worked out the Fed tightening, the dollar should decline as traders take profits. If the Fed does not raise the policy rate (which we also allow), then the market's recent dollar buying would have been pointless. But is it time now to start selling the dollar, and is there a third possible outcome?
In fact, there is. We allow that the market may be searching for new pretexts to buy the dollar, so the Fed decision itself may be unimportant and merely serve as an excuse. In that case, the dollar would continue to rise, and the next day nearly all analysts would claim the move was logical because the Fed tightened policy. Nobody would recall the prior three-day rally. Once again we emphasize that post-hoc explanations for any move are easy: you only need to pick fitting factors. Forecasting the move in advance is the hard task.
We believe that beyond the Fed meeting — which could be hawkish — no fundamentals are supporting further dollar gains. Therefore, we expect the U.S. currency to resume its decline after the Fed announces its decision. EUR/USD has retraced roughly 50% of the last leg up visible on the daily chart, and the Ichimoku cloud on that timeframe has been overcome. The fundamental backdrop does not support the dollar, nor does geopolitics. Consequently, we regard the recent dollar strength, as before, as a correction.
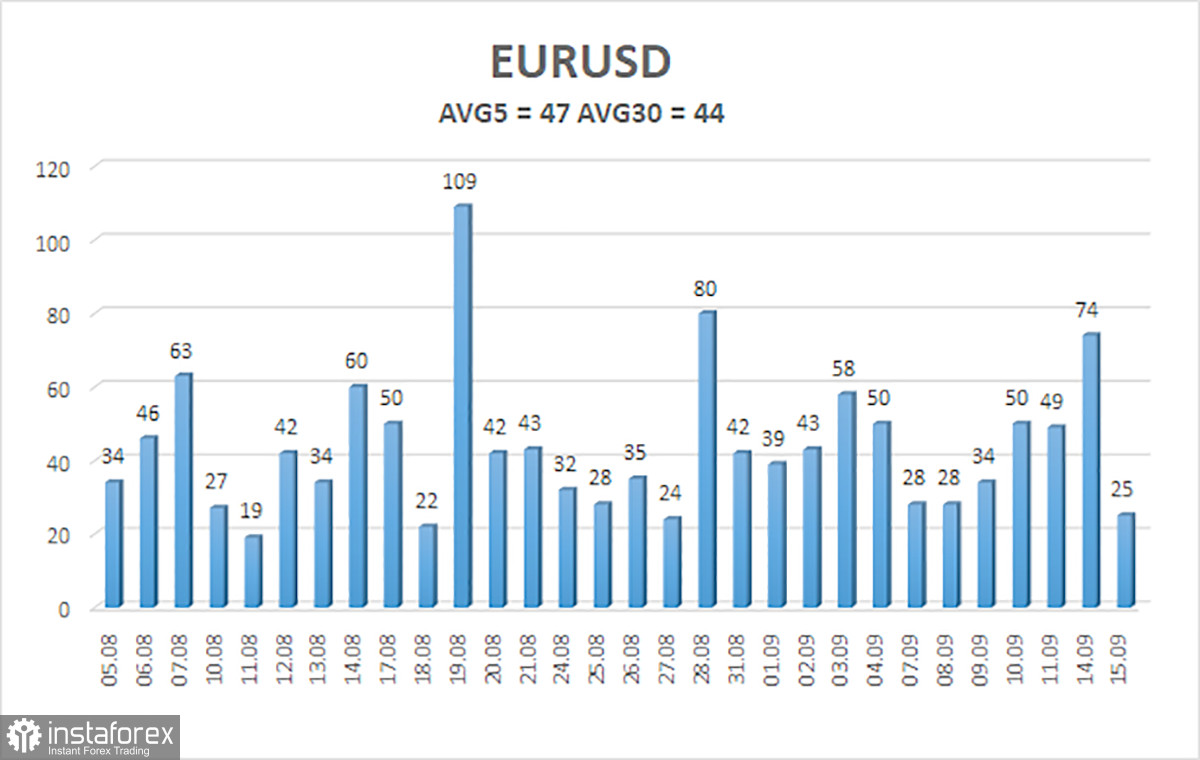
The average volatility of the EUR/USD currency pair over the last 5 trading days as of September 15 is 47 pips and is classified as "low." We expect the pair to trade between 1.1496 and 1.1590 on Wednesday. The higher linear regression channel points up, indicating an uptrend. The CCI entered the oversold area for the second time, warning of a possible end to the downward correction. A bullish divergence has also formed.
S1 – 1.1536
S2 – 1.1475
S3 – 1.1414
R1 – 1.1597
R2 – 1.1658
R3 – 1.1719
The EUR/USD pair continues an uptrend on the 4-hour timeframe, which may be the start of a new leg of a global uptrend on higher timeframes. The global fundamental backdrop for the dollar remains negative, but in 2026, geopolitics first and then the Fed's hawkish stance provided strong support for the US currency. However, at present, those factors no longer support the dollar. With the price below the moving average, consider short positions on a corrective basis, targeting 1.1496 and 1.1475. Above the moving average line, long positions remain relevant, with targets at 1.1658 and 1.1719.
Regression channels help determine the current trend. If both are directed in the same direction, it means the trend is currently strong;
The moving average line (settings 20,0, smoothed) defines the short-term trend and the direction in which trading should be conducted at present;
Murray levels are target levels for moves and corrections;
Volatility levels (red lines) are the probable price channel within which the pair will spend the next 24 hours based on current volatility indicators;
The CCI indicator – its entry into the oversold area (below -250) or the overbought area (above +250) indicates that a trend reversal in the opposite direction is approaching.

