
Сондай-ақ қараңыз


 18.09.2026 06:31 AM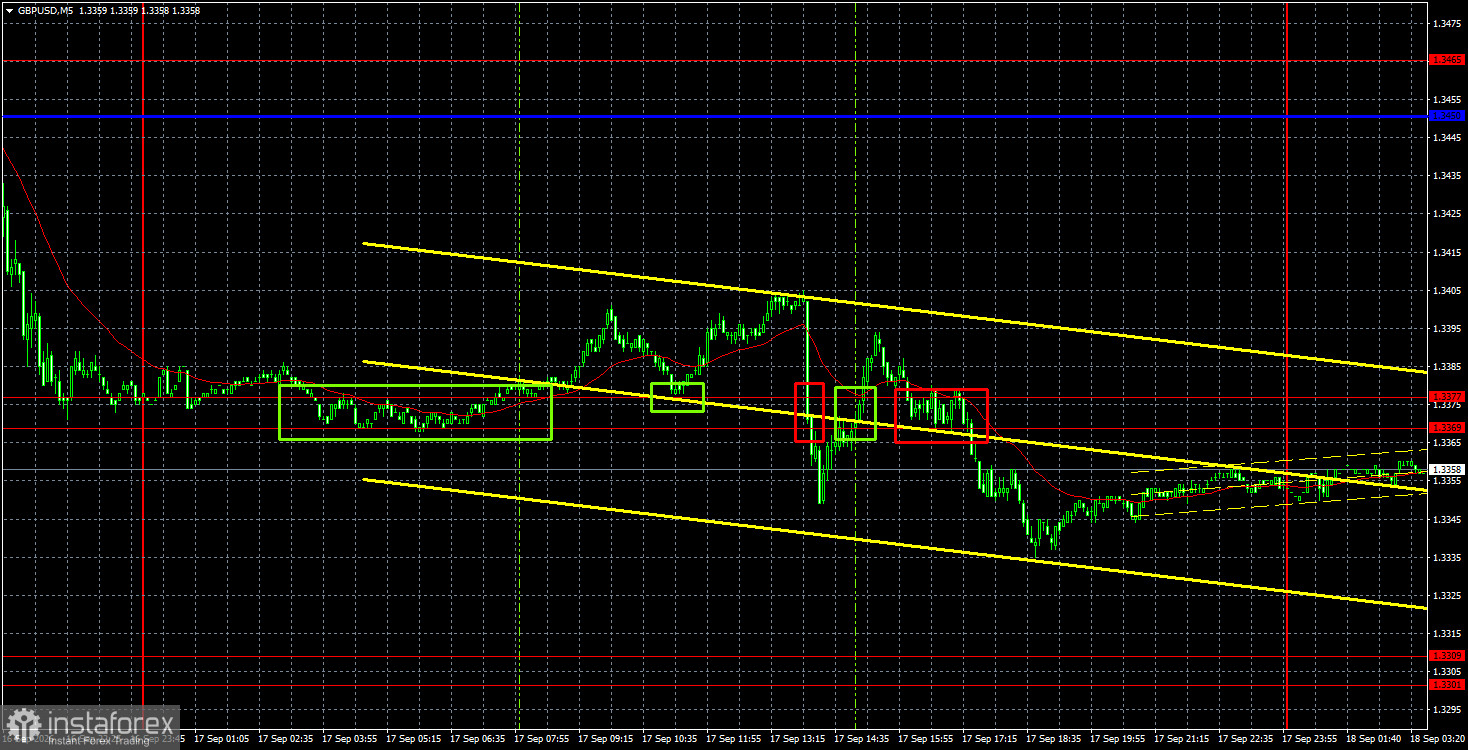
The GBP/USD pair continued its decline on Thursday, a drop that began a week or two ago. Recall that the market first "actively prepared" for Federal Reserve tightening and then, post-factum, decided to reprice the rate hike again. Yesterday the Bank of England met and indicated it may raise rates before year-end. Yet traders treated that fact as negative for the pound and sterling continued to fall. At present nearly every factor is being read as dollar-positive. Even if the BoE had hiked 50 bps yesterday, the pound might still have fallen "because the BoE decision was not hawkish enough." Thus sterling's near-collapse owes mainly to the Fed's move to tighten now while the BoE may only begin tightening closer to year-end. Today GBP/USD may attempt a correction, since the decline has taken on the feel of a "free-fall," but given current market sentiment we would not be surprised to see further dollar gains today.
Technically, sterling continues forming a downtrend. Now the pound can at best hope for corrective moves within the downtrend. The dollar will not rise every day as it did Wednesday evening, but even a neutral BoE outcome yesterday triggered further sterling weakness.
On the 5-minute timeframe on Thursday, several trading signals formed. Price initially bounced twice from the 1.3369–1.3377 area, which gave traders opportunities to open long positions. The northbound impulse failed to develop because the BoE meeting caused a renewed sell-off. After the BoE statement, three more signals appeared, but emotion drove the market, which largely ignored technical levels.
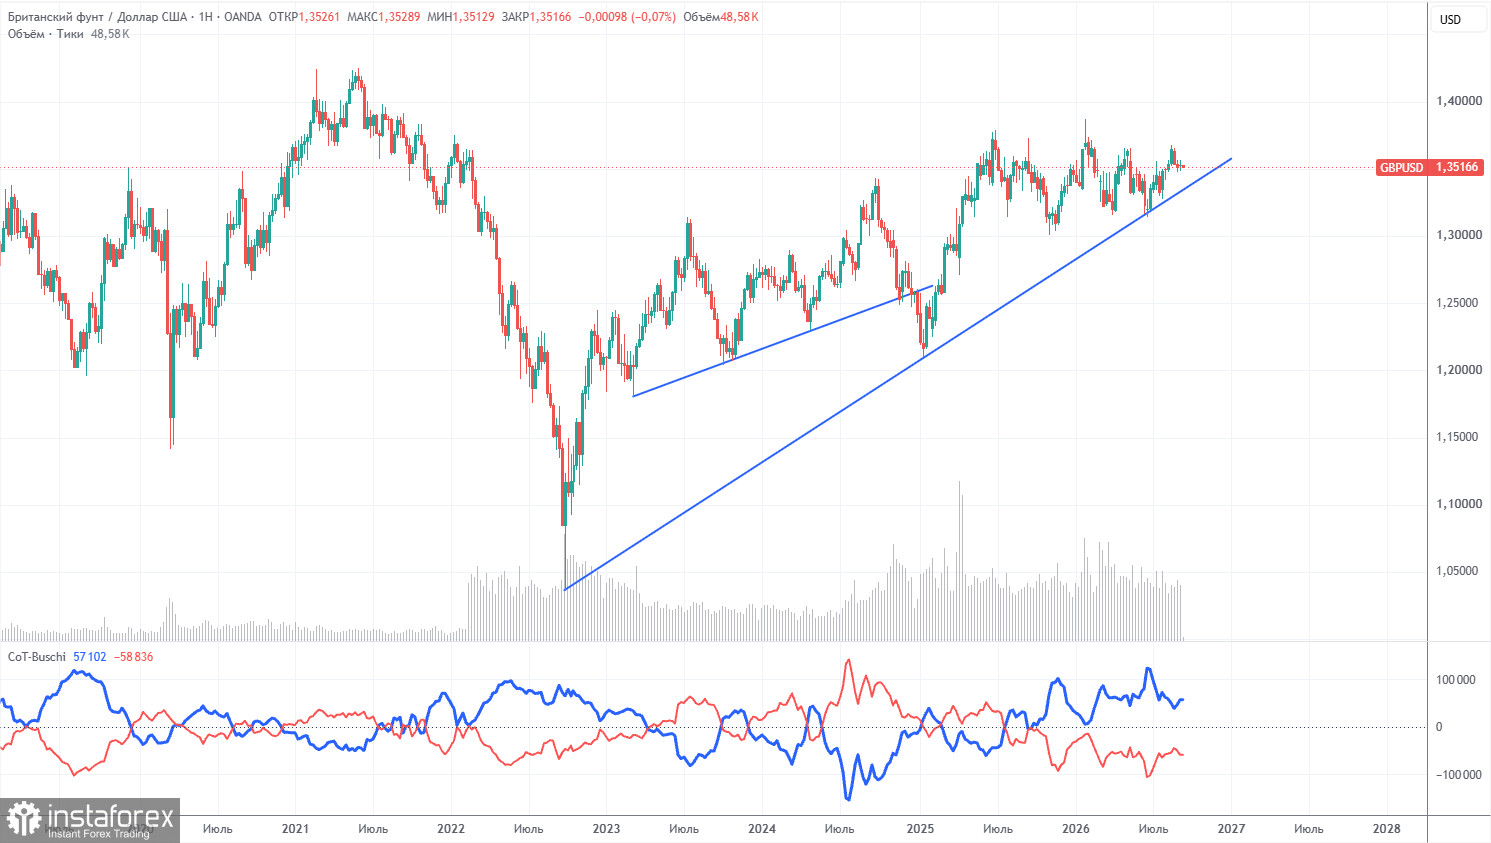
COT reports for the pound show that non-commercial traders have dominated the market with short positions for several months. The net position is negative despite the persistent long-term uptrend. Given events in the Middle East, it is unsurprising that dollar demand was high in the first half of 2026. The war is formally over, but the conflict persists. Only geopolitics can support the US dollar in the near term. However, until the pair closes below the trend line, we would not expect a strong sustained decline.
In the long term, the dollar continues to weaken due to Donald Trump's policies, as seen on the weekly timeframe. The trade war will continue in one form or another for a long time, and Trump's policy is aimed directly and indirectly at weakening the US currency. The long-term uptrend remains, as shown by the trend line. Price recently tested that line and bounced off it. According to the latest COT report (dated September 8), the "Non-commercial" group closed 11,800 BUY contracts and 2,600 SELL contracts. Thus, non-commercial traders' net position fell by 9,200 contracts over the week.
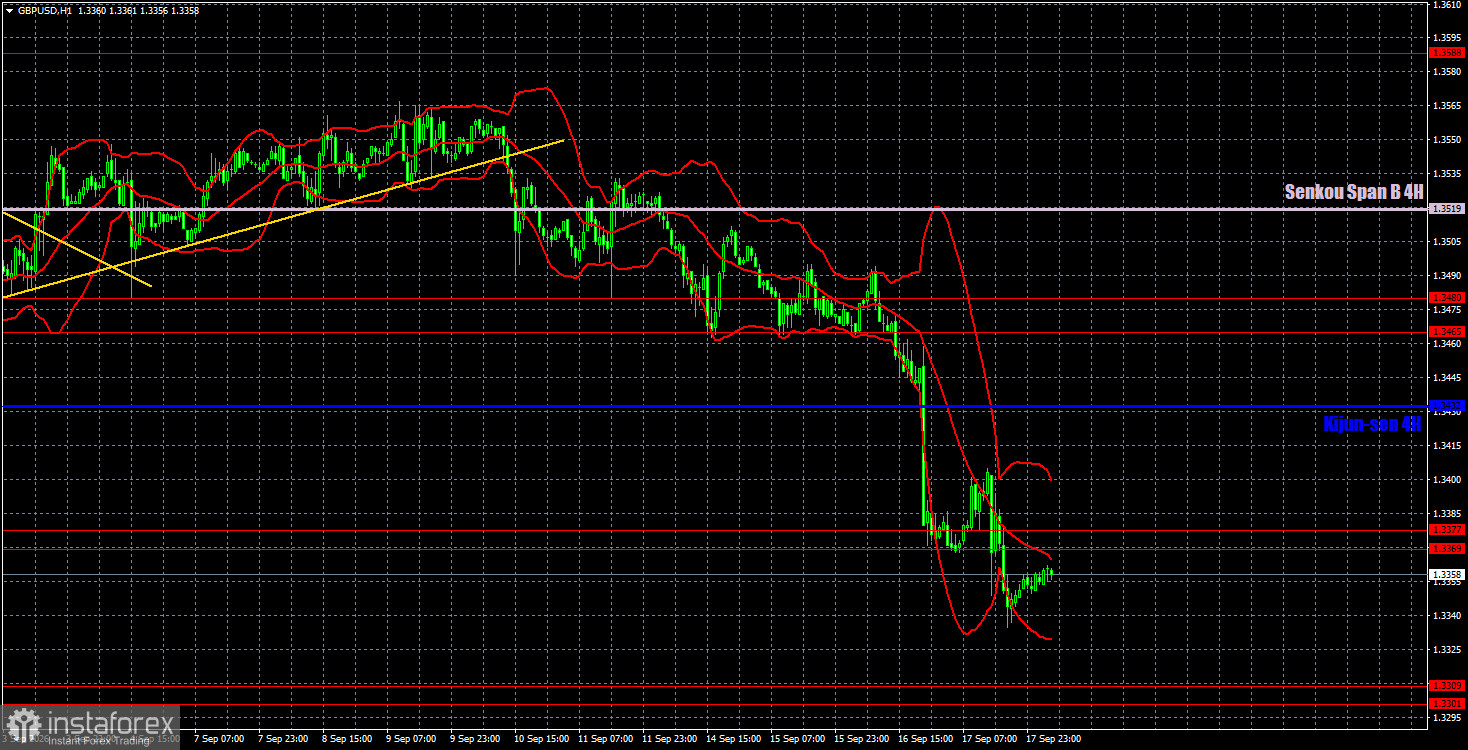
On the hourly timeframe, the GBP/USD pair continues to form a downward trend. The Fed's decision and tone have dramatically changed the outlook for the US dollar. We would say that for the second time this year, a "black swan" arrived in the market, delivering unexpectedly good news for the dollar. Therefore, it is now reasonable to doubt sterling's prospects for sustained gains.
For September 18 we highlight the following important levels: 1.3042–1.3050, 1.3096–1.3115, 1.3179–1.3187, 1.3301–1.3309, 1.3369–1.3377, 1.3465–1.3480, 1.3588, 1.3671–1.3681. The Senkou Span B line (1.3519) and the Kijun-sen (1.3432) can also generate signals. It is recommended to move the Stop Loss to breakeven when the price moves 20 pips in the correct direction. The Ichimoku lines may shift during the day, which should be taken into account when determining trading signals.
Today the UK will publish retail-sales data, and the US will release industrial-production figures. Both reports are of medium significance, so any reaction may be weak and short-lived. Volatility may be low today.
Today, traders may open short positions targeting 1.3301–1.3309 on a rejection from the 1.3369–1.3377 area. Long positions can be opened on a confirmed close above 1.3369–1.3377 with targets at 1.3432 and 1.3465–1.3480.
Support and resistance price levels are thick red lines where movement may conclude. They are not sources of trading signals.
The Kijun-sen and Senkou Span B lines are Ichimoku indicator lines transferred to the hourly timeframe from the 4-hour timeframe. They are strong lines.
Extreme levels are thin red lines from which the price has previously rebounded. They are sources of trading signals.
Yellow lines indicate trend lines, trending channels, and any other technical patterns.
Indicator 1 on COT charts shows the size of the net position of each category of traders.

