
Шунингдек қаранг


 18.09.2026 04:44 AM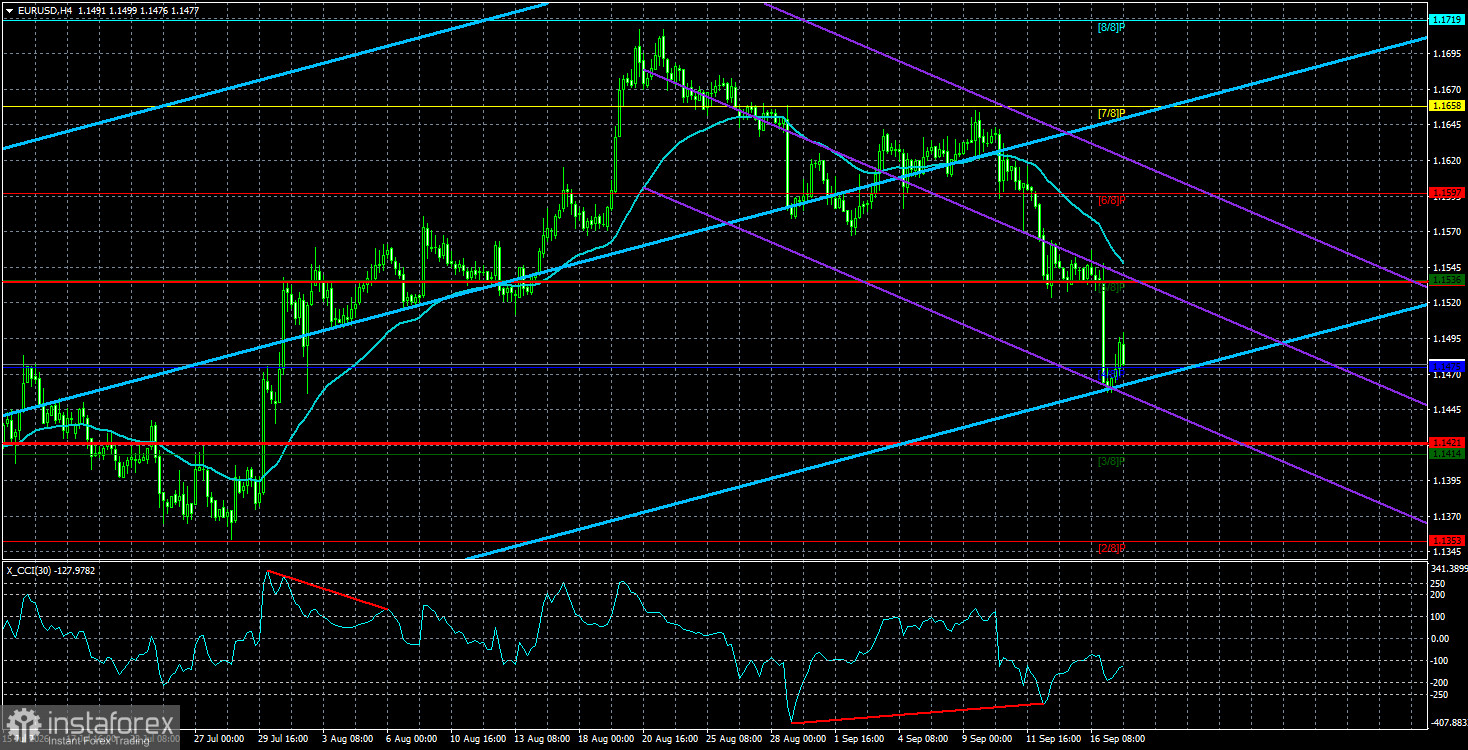
The EUR/USD currency pair found no reason for joy or sorrow on Thursday. More than a day has passed since the Federal Reserve announced its decision, and only now can we draw clear conclusions as the market has calmed and emotions have subsided. So, the first thing that comes to mind — the market found an excuse to buy more US dollars. Of course, the Fed's decision can and should be regarded as "hawkish," but was it so hawkish that, after a week of gains, the dollar rose another 100 pips? Recall that the market began pricing in a Fed rate hike last Thursday, when the European Central Bank decided to tighten monetary policy for the second time this year. For some unknown reason, the market continues to treat the ECB's tightening as nothing, while the Fed's tightening, which had not yet occurred, is everything. That is the first important point, and it cannot be ignored.
The second important point is the fact that the dollar was in demand before the Fed meeting and remained in demand afterward. Someone may say the Fed's results were more hawkish than expected. But what exactly was so "more hawkish"? That all 12 FOMC voting members voted in favor of a hike? If there had been seven instead of twelve, would that have changed anything?
The third important point — signals about future rate increases turned out to be ambiguous. On the one hand, the dot-plot was published and showed an upward revision in the median year-end rate forecast. On the other hand, Kevin Warsh said there is no clear trajectory for the policy rate.
The fourth important point — the market has priced a rate hike for the third time. Recall that after two summer Fed meetings, the dollar also strengthened. So the market worked through summer tightenings twice, then spent almost a week pricing ahead of the September meeting, and after the meeting continued buying the dollar because the Fed may hike again by year-end?
We want to say that even if the Fed's decision was indeed more hawkish, the market has already worked through it for the third or fourth time. At the same time, it simply ignores the ECB's tightening. If someone considers this development natural, we have no objection — traders have many opinions. But we believe the dollar in 2026 squeezes the maximum out of the minimum. Even so, on the weekly timeframe, the pair still trades within a sideways channel that has been in place for over a year. In other words, despite a super-positive 2026, the dollar still cannot show sustained long-term growth. All it can do is wander within a sideways channel.
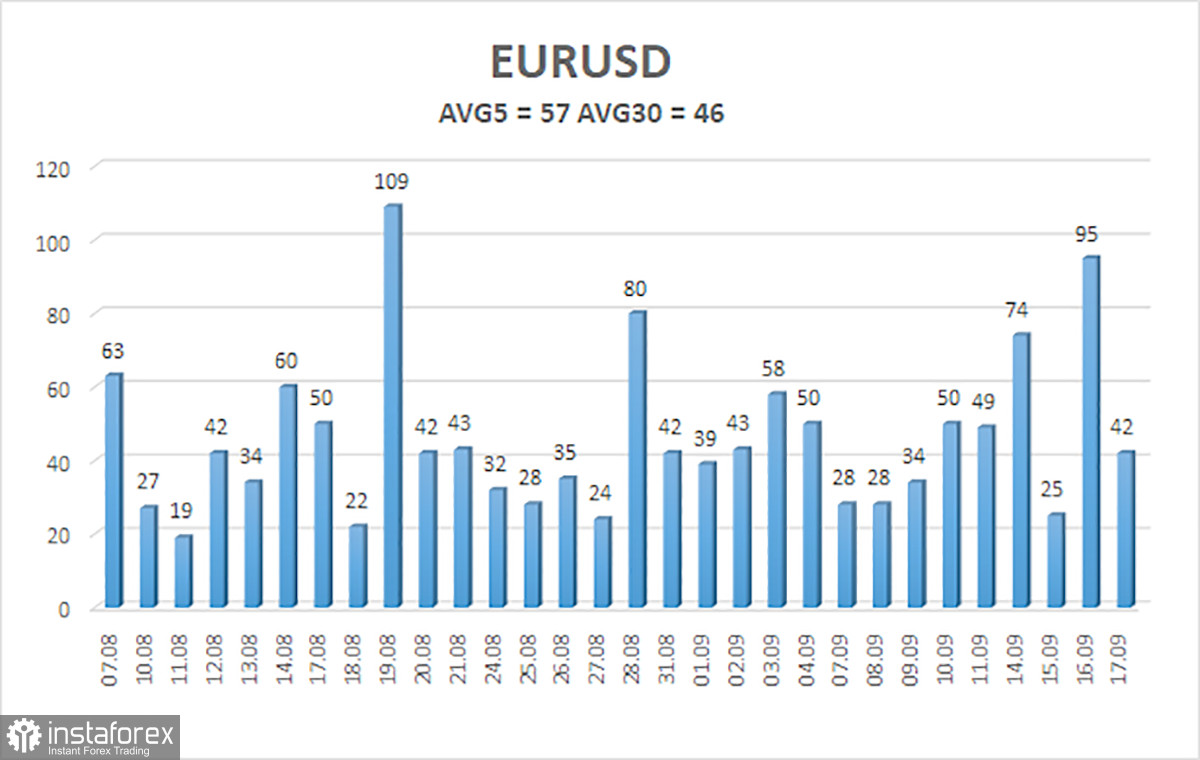
The average volatility of the EUR/USD pair over the last 5 trading days as of September 17 is 57 pips and is classified as "medium." We expect the pair to trade between 1.1421 and 1.1535 on Friday. The higher linear-regression channel points up, indicating an uptrend. The CCI entered the oversold area for the second time and formed two bullish divergences, warning of a possible end to the downward correction.
S1 – 1.1475
S2 – 1.1414
S3 – 1.1353
R1 – 1.1536
R2 – 1.1597
R3 – 1.1658
The EUR/USD pair continues an uptrend on the 4-hour timeframe, which may be the start of a new leg of a global uptrend on higher timeframes. The global fundamental backdrop for the dollar remains negative, but in 2026, geopolitics first and then the Fed's hawkish stance provided strong support for the US currency. However, at present, those factors no longer support the dollar. With price below the moving average, consider shorts with targets 1.1421 and 1.1414. Above the moving average line, long positions remain relevant, with targets of 1.1658 and 1.1719.
Regression channels help determine the current trend. If both are directed in the same direction, it means the trend is currently strong;
The moving average line (settings 20,0, smoothed) defines the short-term trend and the direction in which trading should be conducted at present;
Murray levels are target levels for moves and corrections;
Volatility levels (red lines) are the probable price channel within which the pair will spend the next 24 hours based on current volatility indicators;
The CCI indicator – its entry into the oversold area (below -250) or the overbought area (above +250) indicates that a trend reversal in the opposite direction is approaching.

