
Veja também


 14.09.2026 05:00 AM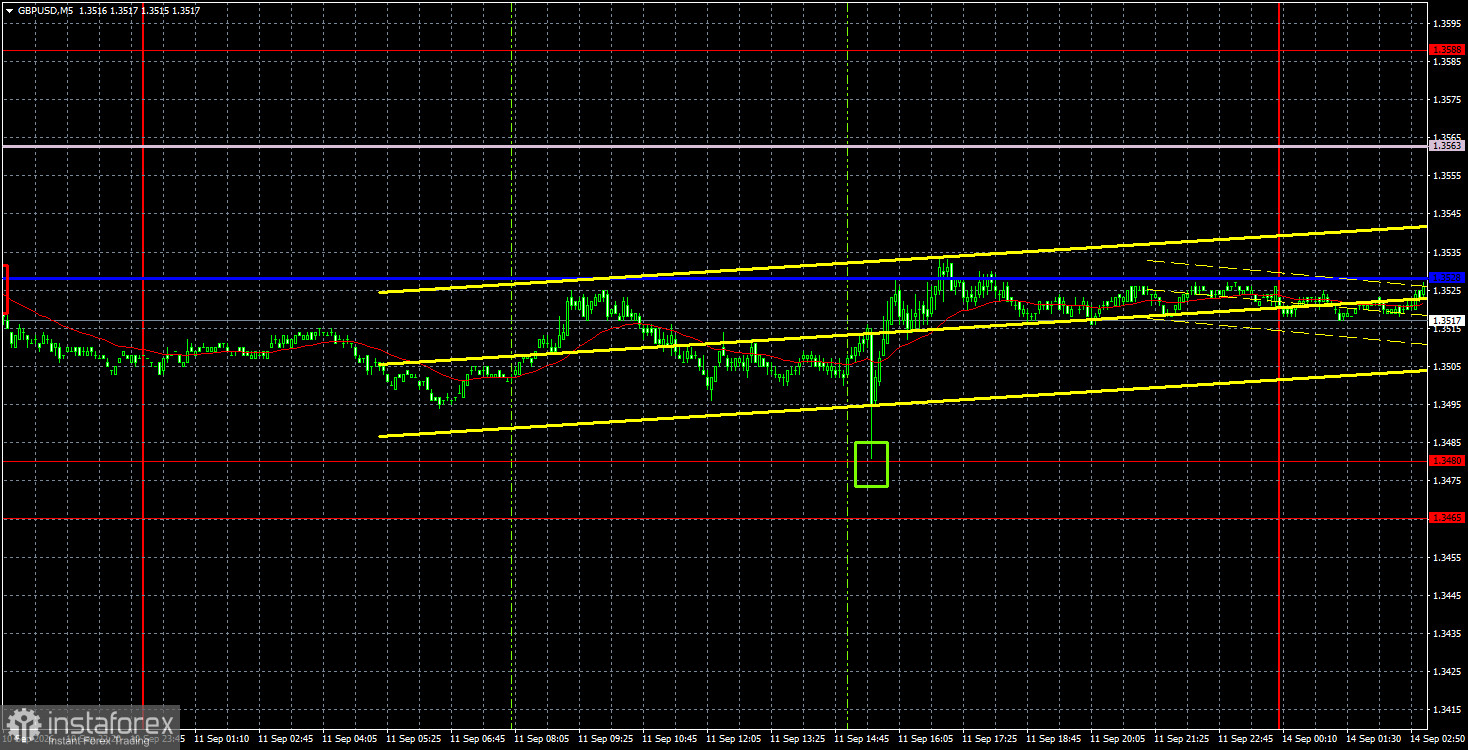
The GBP/USD currency pair on Friday did not follow the euro down, and the market's reaction to the US inflation report suggests it is less convinced of Federal Reserve tightening this week. The US currency fell after US inflation printed 3.4%, unchanged from July. This implies that disinflation stopped, which in a way increases the probability of Fed tightening. At the same time, August inflation did not rise, so there are no new real reasons for the Fed to hike. The Fed meeting situation is paradoxical: on one hand, the market believes in tightening because Kevin Warsh has repeatedly signaled the need to counter high price growth in the US; on the other hand, Warsh is closely linked to Donald Trump, who calls for lower rates. Thus, we assess the probability of Fed tightening this week as 50/50 rather than 90/10. As for the Bank of England, its stance could become more hawkish, but the market does not expect a rate hike on Thursday.
Technically, the pound completed the formation of an uptrend as the trend line was breached. The dollar may continue to strengthen against its peers, although the only clear reason at the moment is the market's belief in Fed tightening.
On the 5-minute TF on Friday, one buy signal formed, allowing traders to earn about 20 pips. During the US session, the price bounced from 1.3480, enabling traders to open clear long positions. By the end of the day, the critical line was met, at which point traders could take profit.
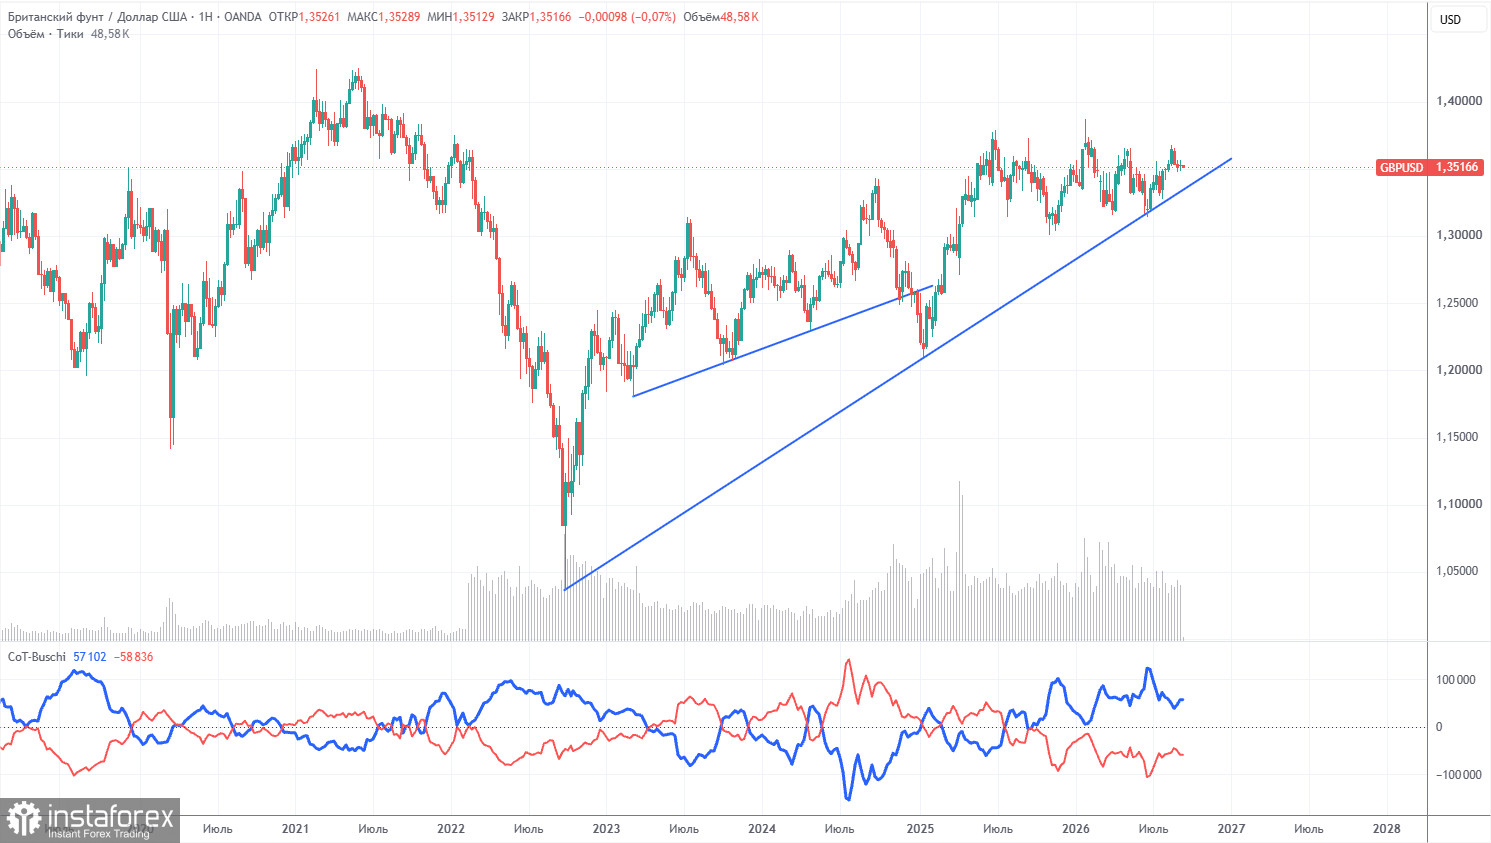
COT reports for the pound show that non-commercial traders have dominated the market with sales for several months. The net position is negative despite the persistence of the long-term uptrend. Given events in the Middle East, it is not surprising that dollar demand was quite high in the first half of 2026. The war formally ended, but the conflict persists. Only geopolitics can support the US dollar in the near term. However, until the pair closes below the trend line, we would not count on a strong decline.
In the long run, the dollar continues to weaken due to Donald Trump's policy, which is clearly visible on the weekly TF. The trade war will continue in one form or another for a long time, and Trump's policy is aimed directly and indirectly at weakening the US currency. The long-term uptrend remains, as evidenced by the trend line. The price recently tested that line and bounced off it. According to the latest COT report (dated September 8), the "Non-commercial" group closed 11,800 BUY contracts and 2,600 SELL contracts. Thus, the non?commercial traders' net position decreased by 9,200 contracts over the week.
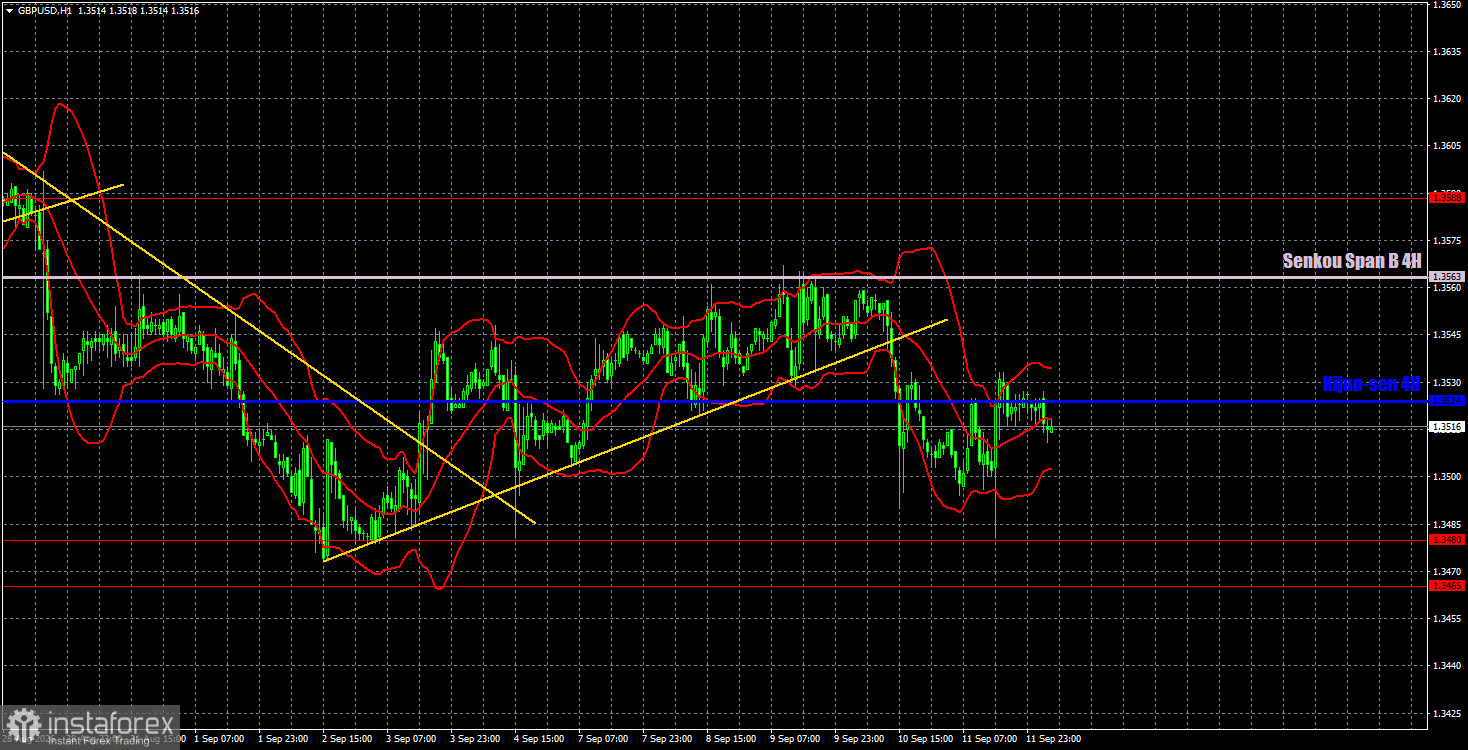
On the hourly timeframe, the GBP/USD pair has moved into a downward trend. In the medium and long term, the pound still "looks" upward, so we consider any sterling rises to be logical. We still do not see strong reasons for a prolonged and significant appreciation of the US currency. Even a hypothetical Fed rate-hike decision has already been priced in by the market multiple times.
For September 14 we highlight the following important levels: 1.3042–1.3050, 1.3096–1.3115, 1.3179–1.3187, 1.3301–1.3309, 1.3369–1.3377, 1.3465–1.3480, 1.3588, 1.3671–1.3681. The Senkou Span B (1.3563) and Kijun-sen (1.3524) lines can also be sources of signals. It is recommended to move the stop-loss to breakeven when the price moves 20 pips in the correct direction. The Ichimoku lines may shift during the day, which you should take into account when determining trading signals.
No major events are scheduled in the UK or the US on Monday, so we will likely see weak, mostly sideways moves today. The market will wait for Wednesday and the Fed's verdict.
Today, traders may open short positions targeting 1.3465–1.3480 and 1.3377 if the price bounces off the Kijun?sen line. Long positions can be opened if the price bounces from the 1.3465–1.3480 area, with targets at 1.3524 and 1.3563. Volatility today may be low.
Support and resistance price levels are thick red lines where movement may conclude. They are not sources of trading signals.
The Kijun-sen and Senkou Span B lines are Ichimoku indicator lines transferred to the hourly timeframe from the 4-hour timeframe. They are strong lines.
Extreme levels are thin red lines from which the price has previously rebounded. They are sources of trading signals.
Yellow lines indicate trend lines, trending channels, and any other technical patterns.
Indicator 1 on COT charts shows the size of the net position of each category of traders.


