
Смотрите также


 18.09.2026 09:51 AM
Bitcoin and Ethereum have been trading sideways within relatively narrow ranges for several weeks following their sharp rally in mid-August. However, this absolutely does not mean that the downtrend that began last year has come to an end. On the daily timeframe, Bitcoin is trading within a sideways range of $60,000–$82,500, while the weekly timeframe continues to show a downtrend. Therefore, regardless of what anyone may say, we do not believe that a new "bullish" trend began over the summer. Importantly, most experts continue to point to the magic of the four-year cycle, according to which Bitcoin should complete its year-long downward correction this fall and begin forming a new "bullish" trend. However, the four-year cycle is not the Great Pyramid of Giza. It is not eternal.
In our view, it was only at the beginning of September that Bitcoin was given two serious reasons to start another decline. First, the US Senate once again blocked the Clarity Act, with the opposition coming not only from Democrats but also from several Republicans. Then the Federal Reserve did not simply raise its key interest rate; it effectively signaled its readiness to continue tightening monetary policy. This means that markets can now reasonably expect another two or three rounds of tightening. Is it worth reminding anyone that a Fed rate hike is a negative factor for Bitcoin?
Incidentally, following these two events, shares of many companies associated with cryptocurrencies or crypto investments declined. For example, Coinbase shares lost around 10%, while Strategy shares fell by 5%. Company representatives note that the fundamental basis for Bitcoin's growth has deteriorated, but that "their internal models still point to favorable prospects." What exactly these "favorable prospects" are and what they are based on, however, nobody explained. Bitcoin will simply keep rising, period!
Notably, Democrats once again pointed to Donald Trump's personal financial interests in the passage of the Clarity Act. This is precisely why they are unwilling to vote "yes." At present, experts do not expect another vote before the midterm elections for Congress. Most likely, a new vote will take place in 2027, with a new composition of both the House of Representatives and the Senate. However, the probability of Republicans losing the elections is very high, meaning that the new Congress could be much more "Democratic" than the current one. In that case, the chances of the Clarity Act being passed would become even lower.
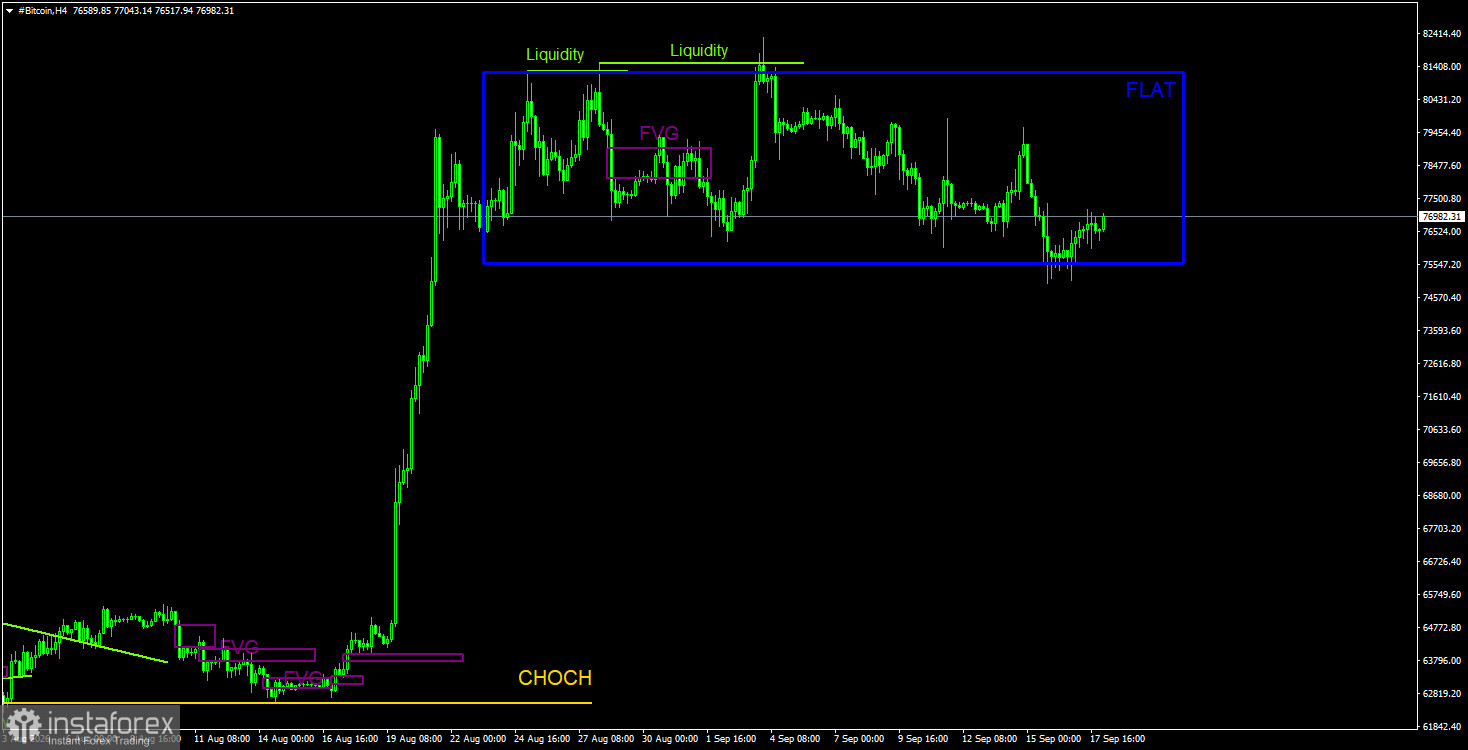
Bitcoin continues to form a downtrend despite its strong rally in mid-August. We continue to expect a decline toward $57,500 (the 61.8% Fibonacci level of the three-year uptrend), although this level has, essentially, already been tested. However, we do not believe that the downtrend has ended there.
The latest rally in the leading cryptocurrency looks very little like a correction, but this alone cannot be considered a strong enough argument for opening long positions. Liquidity could be taken from the $82,850 high, potentially triggering another leg of the downtrend. On the 4-hour timeframe, the rally may continue toward targets of $78,400 and $81,200, as a deviation was formed near the lower boundary of the sideways range.
On the daily timeframe, the technical picture for Ethereum changed completely in just a few days. Ethereum may now begin a new uptrend. However, traders can currently rely only on the weekly chart, where Ethereum could target $4,800, which represents the upper band of the five-year sideways range.
On the daily timeframe, the nearest bearish FVG has been filled, but this FVG belongs to the previous trend. If it triggers a market reaction, that reaction will most likely be corrective.
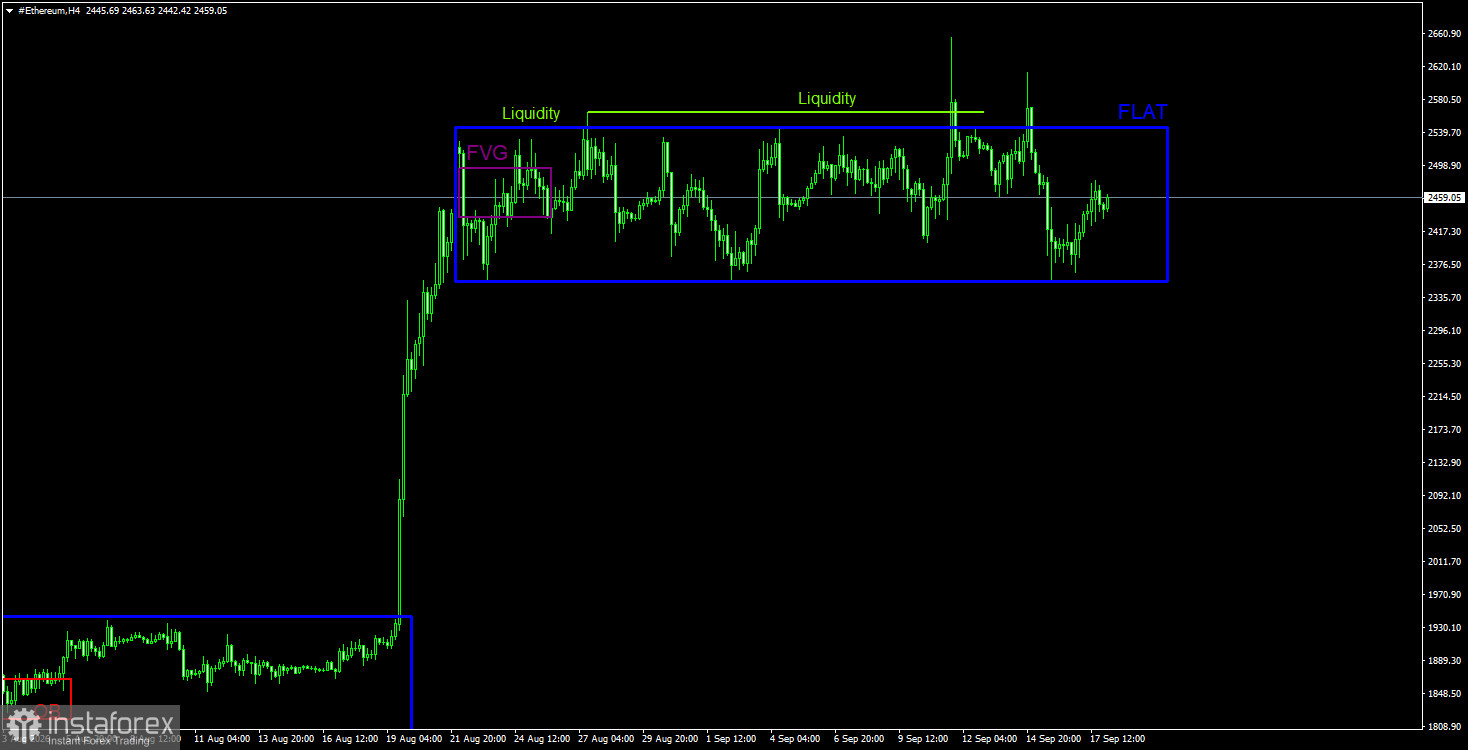
After two deviations above the upper band of the range on the 4-hour timeframe, Ethereum declined toward the lower band. No deviation was formed near the lower band, but there was a straightforward rebound — already the third one — which can also be interpreted as a buy signal. A similar signal was formed for Bitcoin.
In the coming days, a technical rally toward targets of $2,450 and $2,544 is possible.
CHOCH is a change of character / break of the trend structure. Liquidity means traders' Stop?Losses that market makers use to build their positions. FVG stands for a Fair Value Gap (area of price inefficiency). The price often moves quickly through such areas, indicating the absence of one side in the market. Later, the price tends to return and react to these zones. IFVG is an Inverted Fair Value Gap. After a return to such a zone, the price does not react but impulsively breaks through and then tests it from the other side.
OB means an Order Block. A candle on which a market maker opened a position in order to harvest liquidity and then form their own position in the opposite direction.


