
อ่านรายละเอียดเพิ่มเติม


 14.09.2026 04:08 AM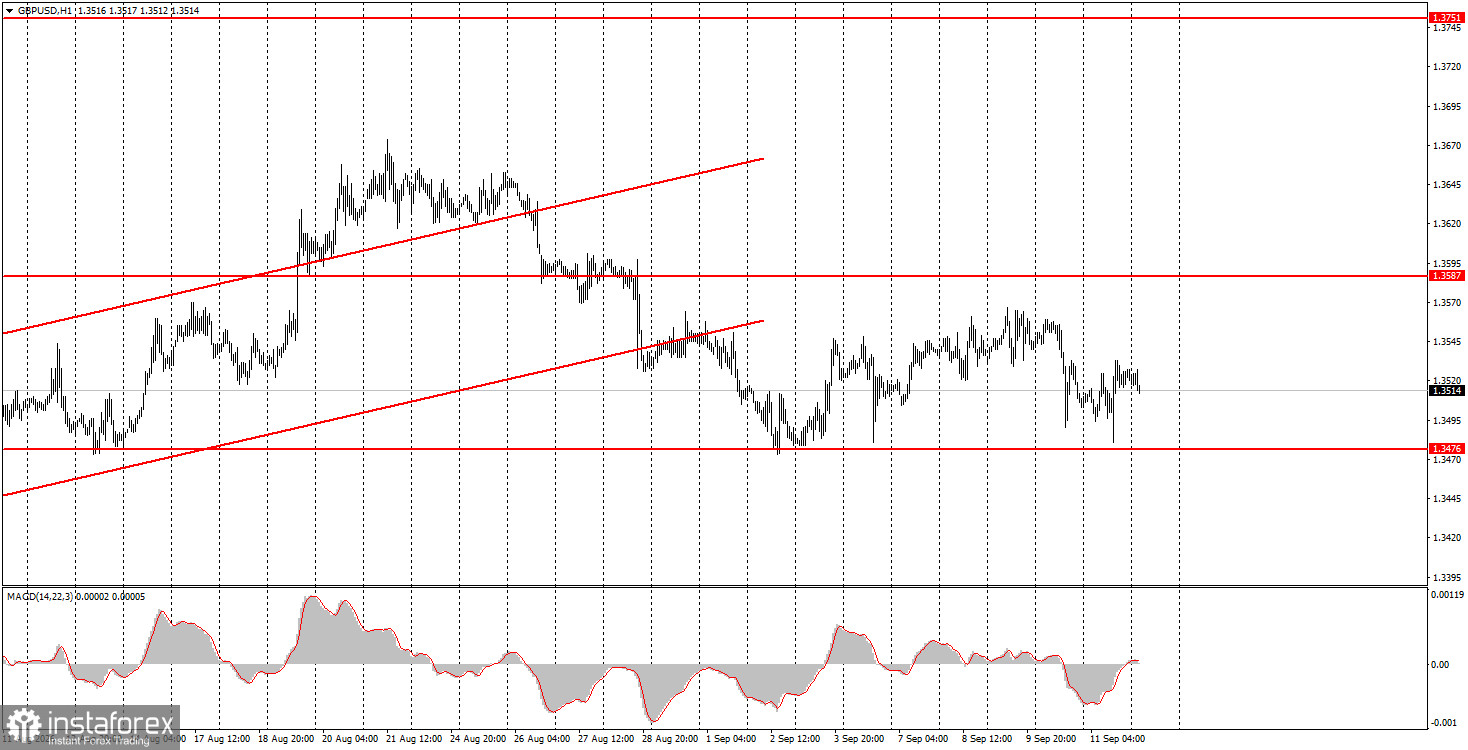
The GBP/USD pair showed a modest decline on Friday but overall traded with low volatility again, despite the US inflation report the market had been awaiting all week. The inflation report did not provide a definitive answer as to whether the Federal Reserve will raise the key rate this week, yet the market has already formed its final view: the rate will be raised by 0.25% on Wednesday evening. We will see if that is indeed the case. Last week, the US dollar did not demonstrate any explosive or confident rise, so we cannot yet speak of full market conviction in Fed tightening. A fair summary may be: the market is verbally certain but not in action. Just as the Fed rhetorically commits to fighting high inflation, we do not see any truly hawkish moves in practice from the US central bank. The only real support for the dollar remains the market's belief in Fed tightening.
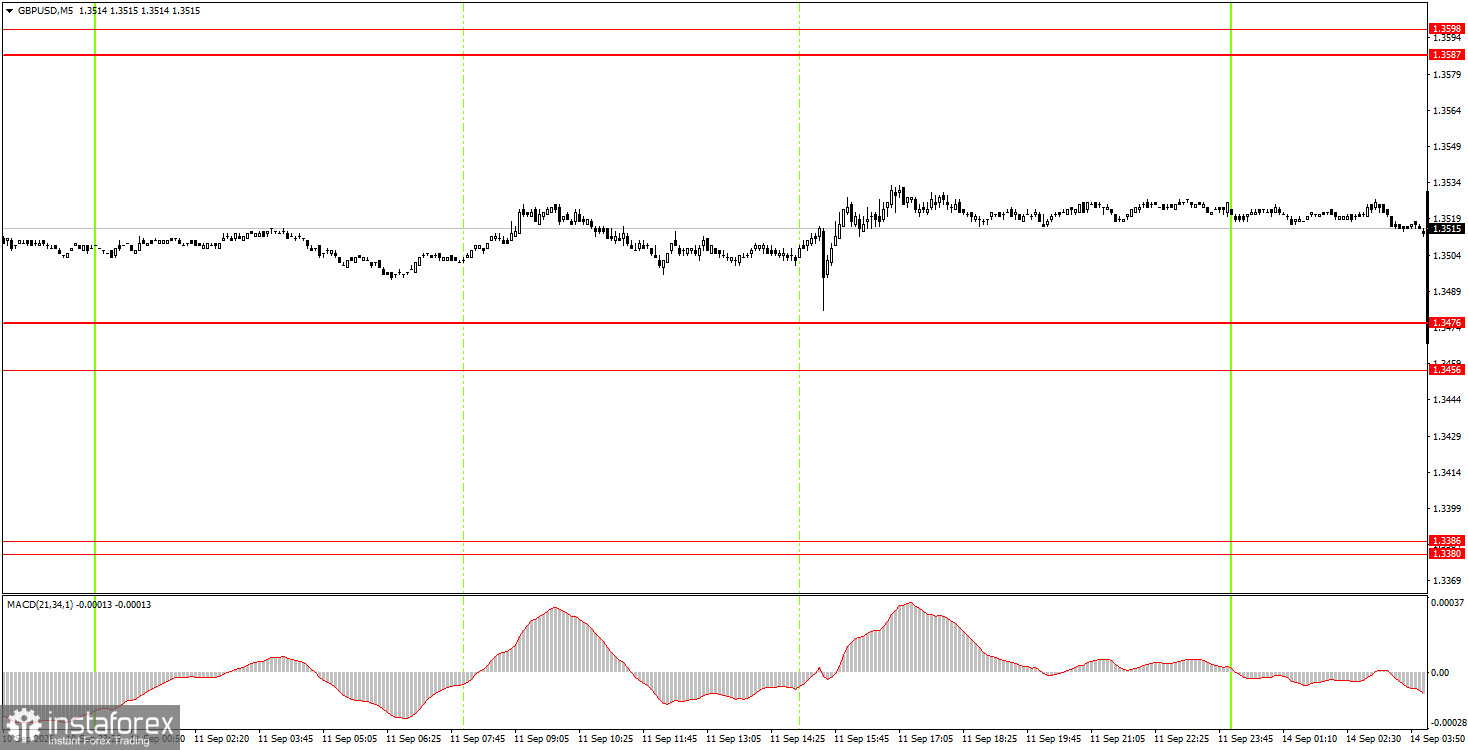
On the 5-minute timeframe on Friday, no trading signals were formed. Despite relatively decent intraday moves, price failed to interact meaningfully with any key levels or zones.
On the hourly timeframe, the GBP/USD pair continues a downward corrective trend that may finish soon. In our view, the pound should continue to rise in the medium term under any scenario, but currently it is undergoing a correction. On the weekly chart, the move from the lower boundary of the sideways channel toward the upper boundary continues and may not be complete. Therefore, we expect a resumption of the northbound impulse.
On Monday, novice traders may consider short positions targeting 1.3380–1.3386 if price consolidates below the 1.3456–1.3476 area. Long positions can be opened targeting 1.3587–1.3598 in case of a bounce from the 1.3456–1.3476 area.
On the 5-minute timeframe, you can trade the levels 1.3259–1.3267, 1.3319–1.3331, 1.3380–1.3386, 1.3456–1.3476, 1.3587–1.3598, 1.3631–1.3641, 1.3695, 1.3741. No major events or releases are scheduled for Monday in the UK or the US. Thus, we can again expect muted intraday moves today.
Price levels (areas) of support and resistance serve as targets for opening buy or sell trades or as sources of signals.
Red lines indicate channels or trend lines that show the current trend and the preferred trading direction.
The MACD indicator (14,22,3) — the histogram and signal line — is an auxiliary indicator that can also provide signals.
Important speeches and reports (listed in the news calendar) can significantly influence currency pair movements. Therefore, during their release, traders should approach trading with utmost caution, or exit the market to avoid sudden reversals against the preceding move.
Beginner forex traders should remember that not every trade can be profitable. Developing a clear strategy and practicing money management are key to long-term success in trading.


