
Shuningdek qarang


 18.09.2026 07:20 AM
The 1-hour (H1) chart for Gold (GOLD) shows continued positive price action and movement within overlapping bullish channels. The price is currently trading around the 4366.42 level, driven by positive momentum that has allowed it to break back above key pivot lines.
Technical Reading and Price Action
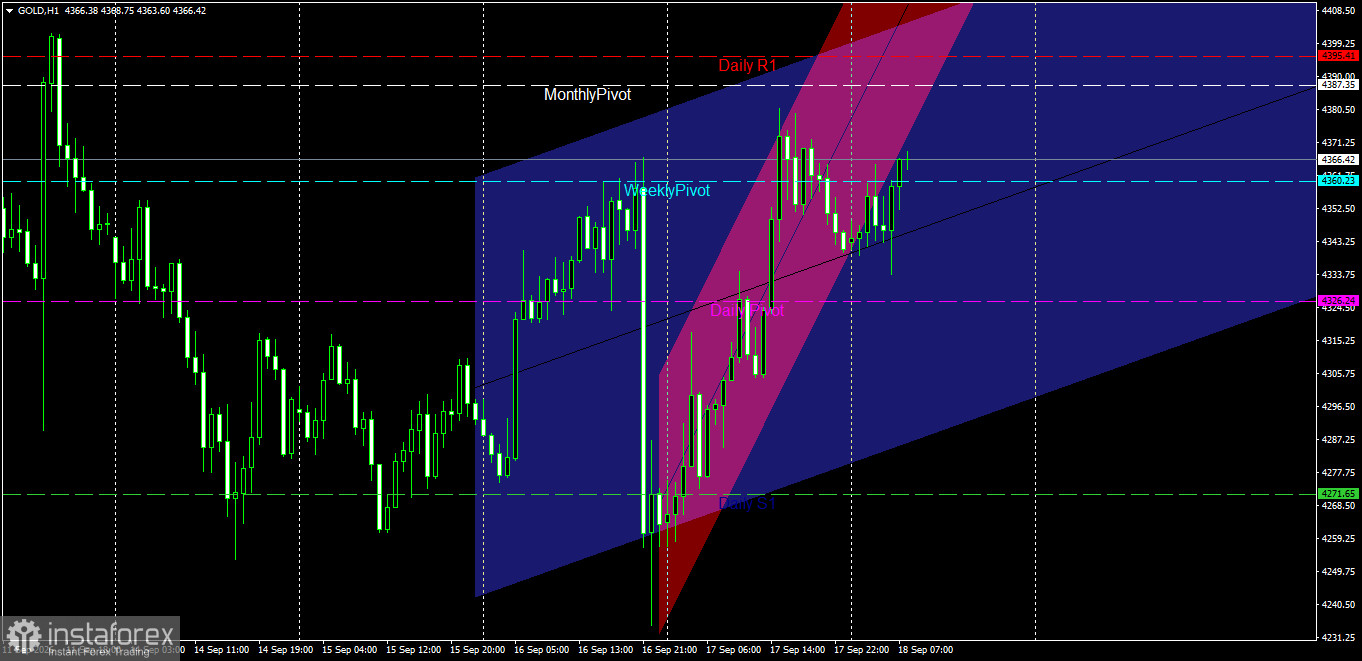
Price Channel Structure: The price is moving within a primary bullish channel (blue) representing the near-term trend, alongside a faster-momentum corrective channel (pink). The price recently staged a strong rebound from the lower boundaries of these bullish channels, near the first daily support level (Daily S1) at 4271.65.
Interaction with Pivot Levels: Buyers regained upward momentum, breaking through the daily pivot point (Daily Pivot) at 4326.24. The price continued to extend higher, breaking above the weekly pivot point (Weekly Pivot) at 4360.23 and stabilizing there.
Testing the Midline and Next Resistance: The price is currently trading near the midline of the blue channel, pushing toward the first daily resistance zone (Daily R1) at 4395.41 and the monthly pivot point (Monthly Pivot) located near 4387.35.
Key Support and Resistance Levels
Key Resistance Levels:
First Resistance: The range between 4387.35 and 4395.41 (encompassing the Monthly Pivot and Daily R1). Second Resistance: The previous peak recorded near 4408.50.
Key Support Levels:
First Support: 4360.23 (Broken Weekly Pivot, now acting as a support zone).
Second Support: 4326.24 (Daily Pivot and the lower boundary of the pink channel).
Key Support: 4271.65 (Daily S1 and the previous pivotal low).
Price Action Outlook and Trading Scenarios
Bullish Scenario (Primary):
A positive trajectory is the most likely outcome, given continued trading within the ascending blue channel and positioning above the Pivot levels.
Validation Condition: Sustained stability above the 4360.23 level.
Technical Targets: Targeting resistance zones at 4387.35 and then 4395.41 (initial target); a breakout here opens the way to test the peak at 4408.50.
Stop Loss: A one-hour candle close below the 4326.00 level.
Bearish Corrective Scenario (Alternative):
Triggered if the price faces sudden selling pressure that pushes it below the lower boundary of the pink channel.
Validation Condition: Breaking below 4360.23, followed by a break below the Daily Pivot at 4326.24 confirmed by a full one-hour candle.
Technical Targets: Retesting the previous pivotal low and the first daily support level at 4271.65. Risk Management
It is advisable to capitalize on opportunities aligned with the overall upward trend within the price channel and to monitor price action near the 4387–4395 resistance zone to avoid a corrective pullback, while strictly adhering to stop-loss levels to protect capital.
The 4-hour (H4) chart for Gold (GOLD) shows a bullish attempt to break out of the downward corrective phase; the price is currently trading at 4365.87, signaling buyer interest in regaining upward momentum following a rebound from the weekly support zone.
Technical Analysis and Price Action
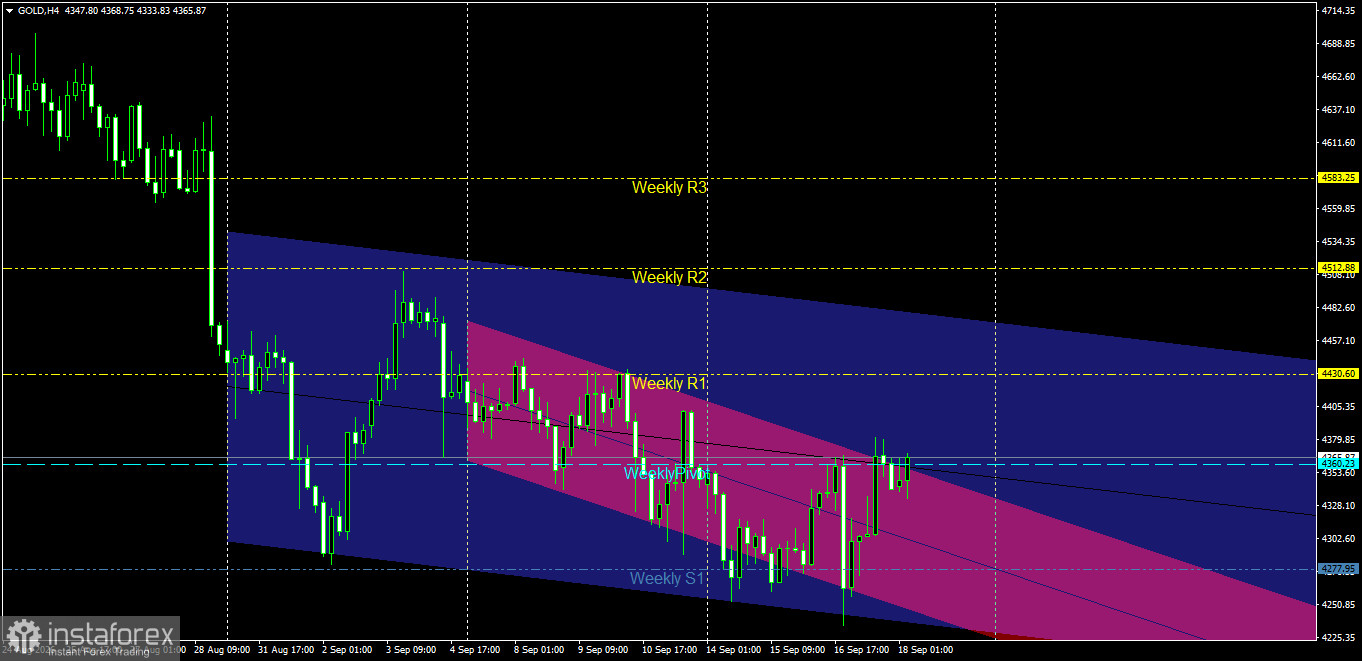
Price Channel Structure: The price has been moving within a primary bearish channel (blue) and a steeper secondary channel (pink). Recently, the price staged a strong rebound from the pivotal low—aligned with the first weekly support level (Weekly S1) at 4277.95—successfully breaking above the upper boundary of the pink channel and rising above the midline of the primary blue channel.
Trading Around the Weekly Pivot: The price is currently testing the Weekly Pivot level at 4360.23, fluctuating near it while attempting to stabilize above it. This move aims to confirm bullish intent and clear the bearish trend line passing near these levels.
Key Support and Resistance Levels
Key Resistance Levels:
Resistance 1: 4430.60 (Weekly R1).
Resistance 2: 4512.88 (Weekly R2).
Key Resistance: 4583.25 (Weekly R3).
Key Support Levels:
Support 1: 4360.23 (Weekly Pivot).
Support 2: The lower boundary of the broken channel, near the 4328.00 – 4302.00 range. Key Support: 4277.95 (Weekly S1).
Price Action Outlook and Trading Scenarios
Bullish Scenario (Primary):
The bullish scenario is the most likely if the price holds above the broken pink channel and the weekly pivot level.
Confirmation Condition: A confirmed close of a full 4-hour candle above the 4360.23 level.
Technical Targets: Targeting the first weekly resistance level at 4430.60 as the primary target; a breakout here opens the way toward 4512.88.
Stop Loss: A 4-hour candle close below the 4325.00 level.
Bearish Scenario (Alternative):
This scenario activates if buyers fail to sustain the price above the pivot and negative momentum returns, pushing the price back inside the bearish channel.
Confirmation Condition: Breaking the 4360.23 level followed by a close below 4328.00.
Technical Targets: A return to retest the weekly support zone at 4277.95.
Risk Management
It is recommended to wait for a confirming 4-hour candle close above the 4360.23 level before opening new long positions. Strict adherence to stop-loss orders is advised to protect capital, and trading risk should not exceed 1% to 2% of the account balance.

